|
|||||
|
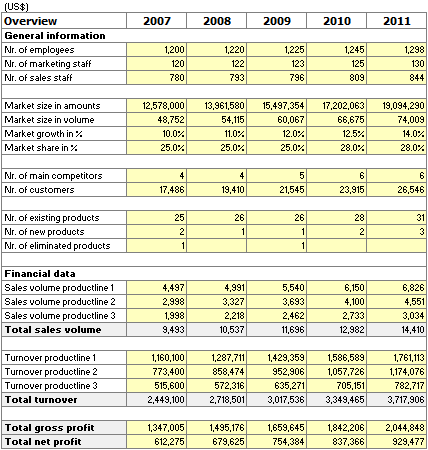
General overview Complete this table with the most important figures of the company.
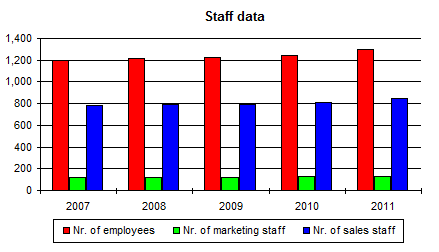
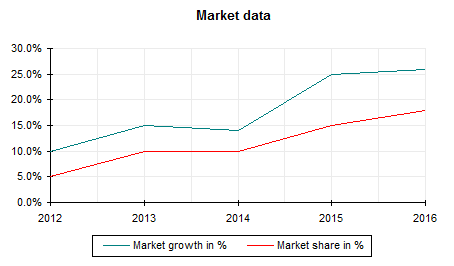
Charts It includes 7 charts (staff data, market data, market size, product data, sales volume per product line, turnover per product line, gross profit vs net profit):
The rest of the charts are not shown here. |
|||||
|
|||||